API Example: Bitcoin price
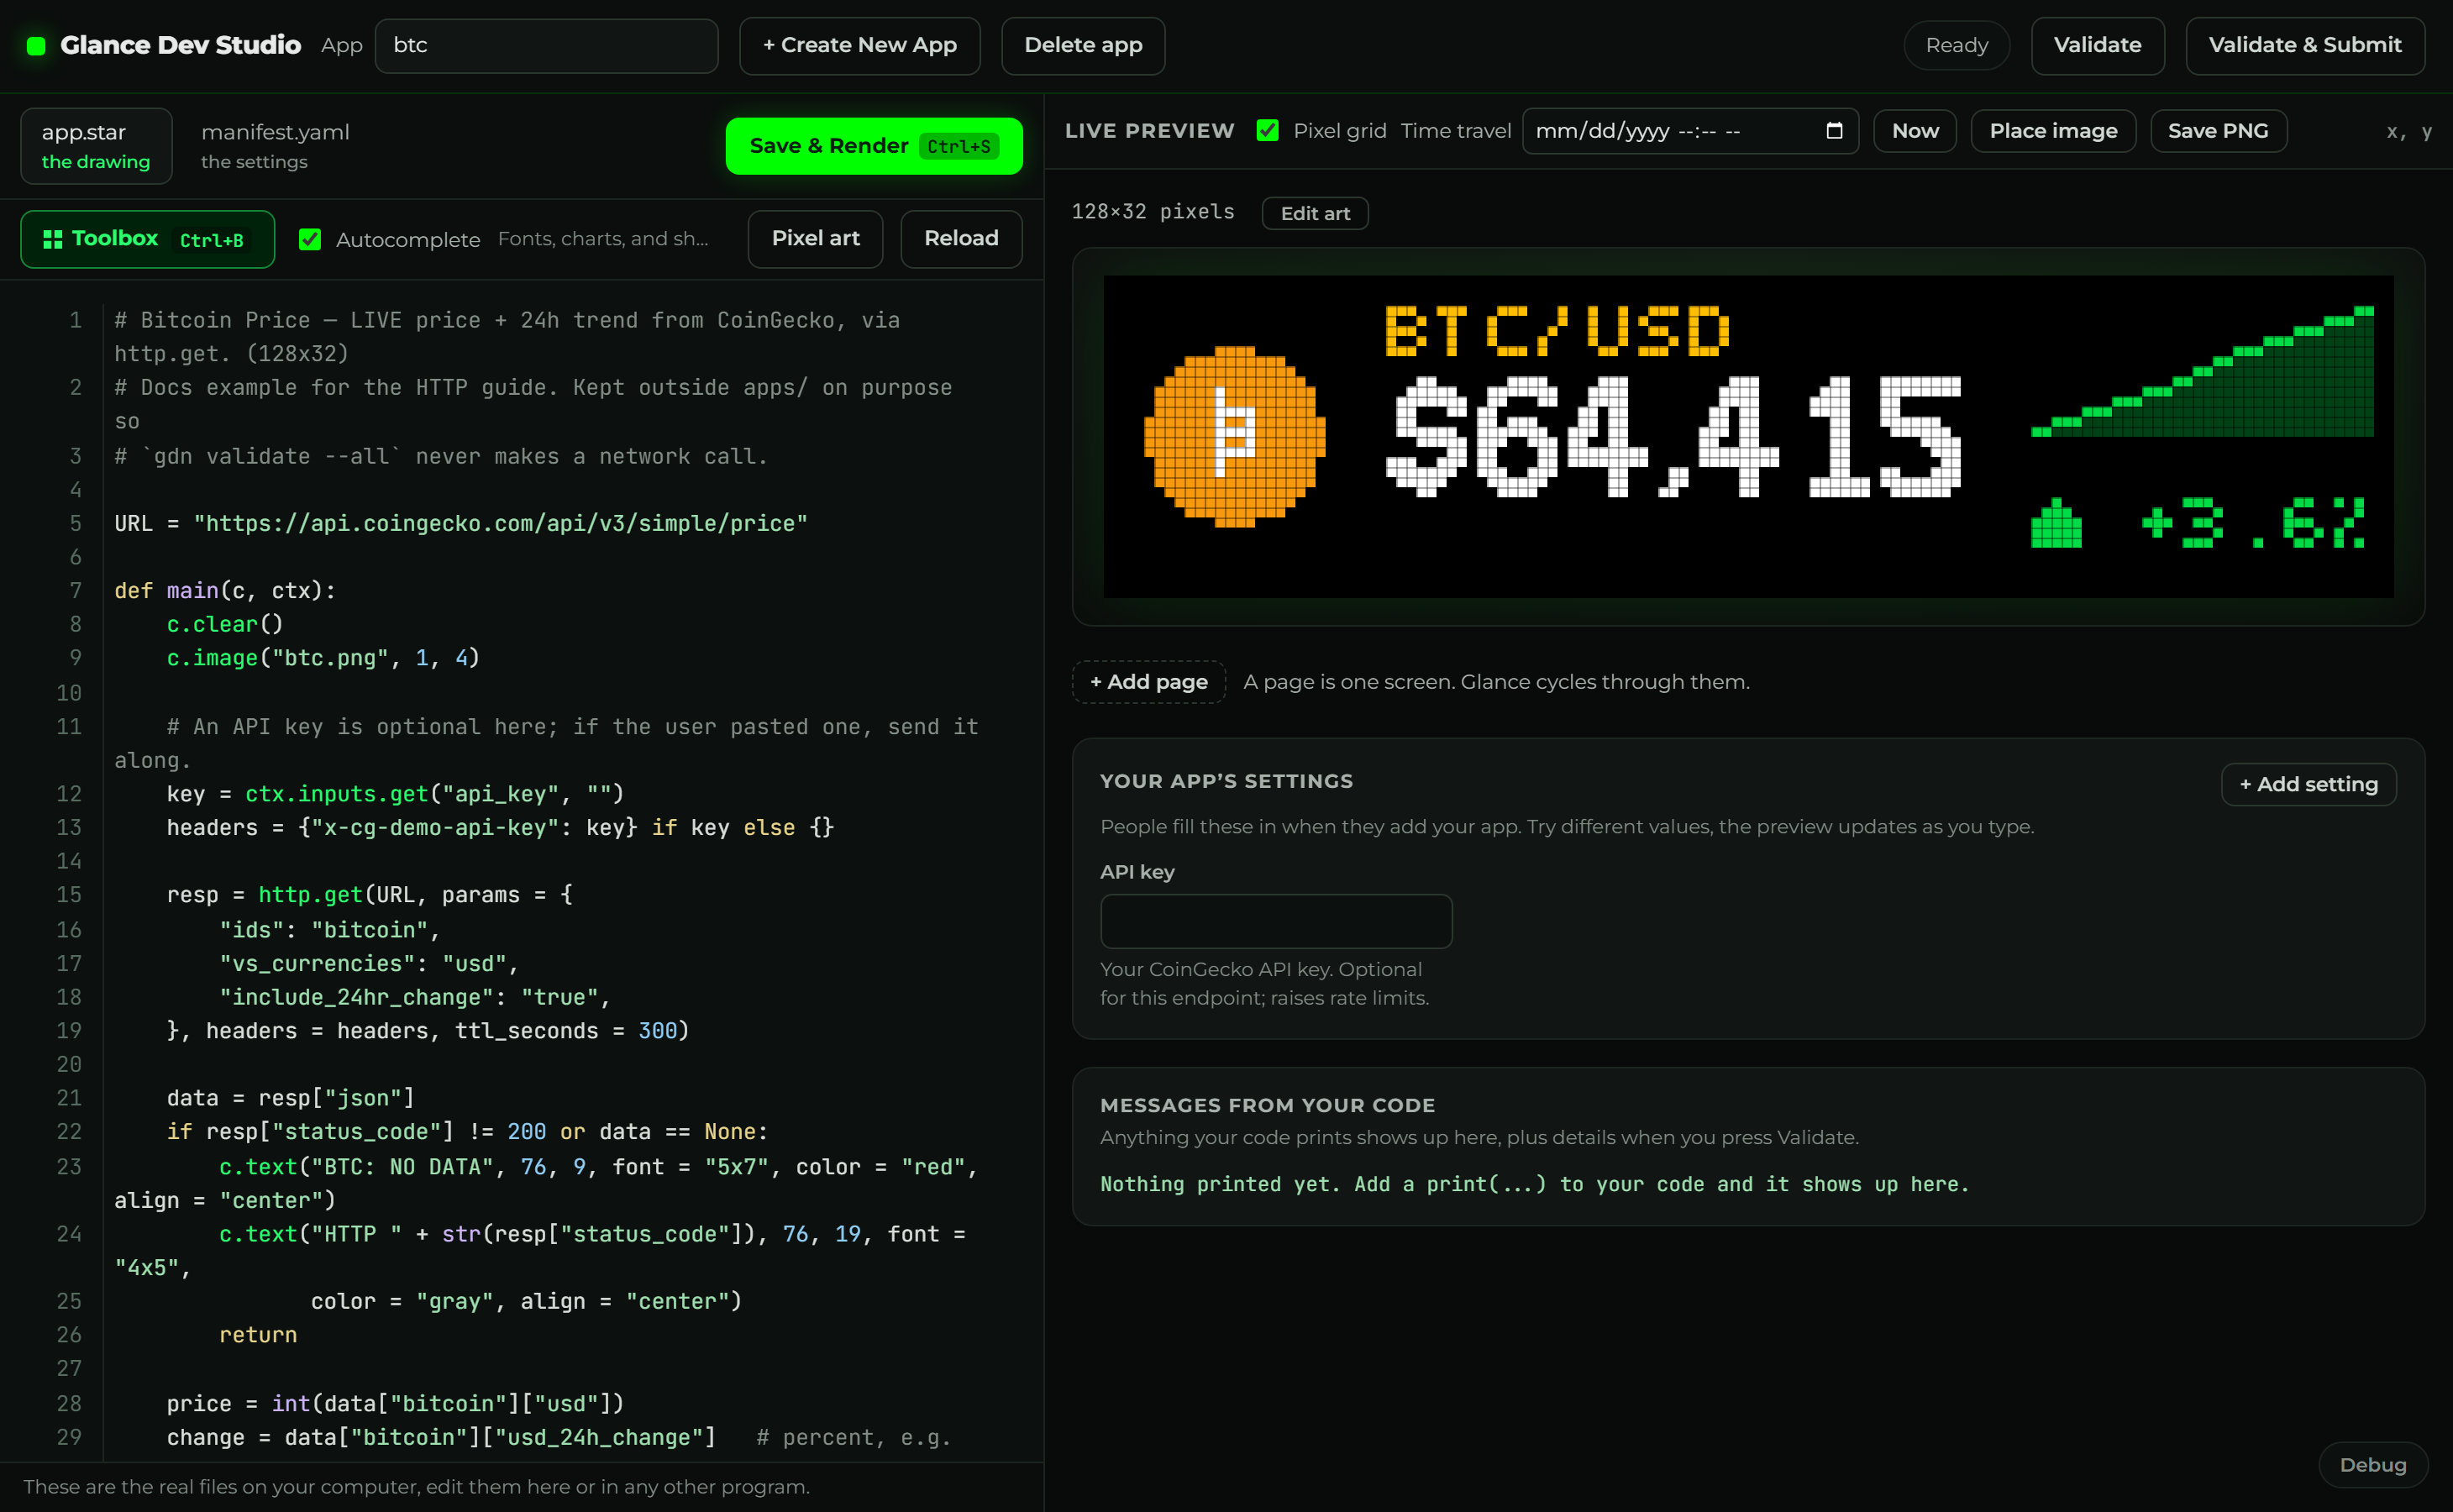
A step past a static sign: a live Bitcoin price with a 24-hour trend, fetched
from the free CoinGecko API with one http.get call. Along the way you'll import a
logo, make an HTTP request, and parse a JSON response, the three things every
live-data app does. You'll build it in Glance Dev Studio, so every save
re-runs the fetch and redraws the panel on the spot:
How live data reaches a GDN app
Your app.star runs in a sandbox, so it can't open a socket itself. Instead it
calls http.get(url) and the GDN host performs the real request on its
behalf, with a hard 5-second timeout and built-in caching, then hands the response
back as plain data. From your code's point of view it's one function call:
- You declare an API key input. The user pastes their CoinGecko key once, in
the Glance app, and it reaches your code as
ctx.inputs["apikey"]. - Your app calls
http.get(...), passing the key in a header. - Your app parses the JSON in the response and draws it.
The full details are on the HTTP requests reference page.
The data
CoinGecko's simple price endpoint:
https://api.coingecko.com/api/v3/simple/price?ids=bitcoin&vs_currencies=usd&include_24hr_change=true
It returns a small JSON object:
{ "bitcoin": { "usd": 63039, "usd_24h_change": 1.32 } }
1. The manifest
Declare the key input and the logo asset:
gdn: 1
id: btc
name: Bitcoin Price
width: 128
height: 32
refresh: 300            # re-check the price every 5 minutes
pages: [main]
assets:
  - btc.png             # the logo we draw
inputs:
  - key: apikey            # api-key key names can't contain _ or -
    app_input_type: api-key  # keys get their own type — this is what encrypts the value
    type: string
    label: API key
    help: Your CoinGecko API key. Optional for this endpoint; raises rate limits.
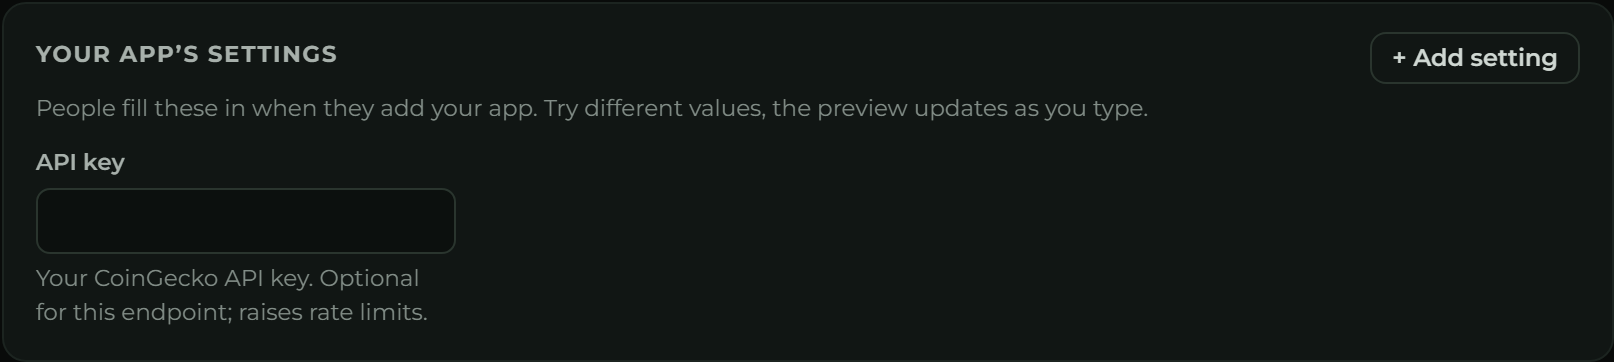
That apikey input becomes a field in the app's settings card in Studio (and on the
user's phone when they add the app), with your help: text shown as the hint underneath:
2. The logo
Save this as btc.png next to app.star:

3. Fetch, parse, draw
This is the complete app.star:
URL = "https://api.coingecko.com/api/v3/simple/price"

def main(c, ctx):
    c.clear()
    c.image("btc.png", 1, 4)

    # An API key is optional here; if the user pasted one, send it along.
    key = ctx.inputs.get("apikey", "")
    headers = {"x-cg-demo-api-key": key} if key else {}

    resp = http.get(URL, params = {
        "ids": "bitcoin",
        "vs_currencies": "usd",
        "include_24hr_change": "true",
    }, headers = headers, ttl_seconds = 300)

    data = resp["json"]
    if resp["status_code"] != 200 or data == None:
        c.text("BTC: NO DATA", 76, 9, font = "5x7", color = "red", align = "center")
        c.text("HTTP " + str(resp["status_code"]), 76, 19, font = "4x5",
               color = "gray", align = "center")
        return

    price = int(data["bitcoin"]["usd"])
    change = data["bitcoin"]["usd_24h_change"]   # percent, e.g. 2.4 or -1.3
    up = change >= 0
    col = "green" if up else "red"

    c.text("BTC/USD", 28, 3, font = "4x5", color = "amber")
    c.text_fit("$" + fmt.commas(price), 28, 10, ["8x12", "6x8"],
               color = "white", maxw = 62)

    # This endpoint returns no history, so sketch the 24h move as a ramp from
    # yesterday's derived price to now. Direction and size are real.
    prev = price / (1.0 + change / 100.0)
    spark = [prev + (price - prev) * i / 11.0 for i in range(12)]
    c.sparkline(spark, 92, 3, 34, 13, color = col, fill = color.dim(col, 30))

    pct = ("+" if up else "") + str(int(change * 10) / 10.0) + "%"
    c.trend_arrow(92, 22, change, color = col)
    c.text(pct, 126, 22, font = "4x5", color = col, align = "right")
The pieces:
http.get(URL, params=..., headers=..., ttl_seconds=300)does the fetch. The query parameters are appended to the URL for you, and the response is cached for 5 minutes so repeated renders don't refetch. See HTTP requests.- Check before you draw.
resp["status_code"] != 200 or data == Nonecatches a down API, a timeout (status_codeis0), and a non-JSON body, and draws a clear fallback instead of crashing. resp["json"]is the response already decoded;data["bitcoin"]["usd"]reads a field, exactly like the JSON shape above.fmt.commas(price)groups the thousands (63039becomes63,039), andc.text_fitpicks the biggest font that fits, so a six-figure price gracefully drops to a smaller font.c.image,c.sparkline, andc.trend_arrowdraw the logo, the mini chart, and the up/down arrow. See Helper functions.
4. Render it
Open the app in Glance Dev Studio and press Save & Render: it runs the fetch and draws the result live, exactly the screenshot at the top of this page. Every save re-renders, so you tweak a color or a coordinate and see the real data redraw instantly.
Prefer the terminal? Both of these work too:
gdn preview examples/btc                          # live browser preview, re-renders on save
gdn render examples/btc --page 1 --out btc.png    # render one page straight to a PNG
Render it twice and the second one is instant, the response is served from the cache for
ttl_seconds. Unplug the network and it still renders (from cache); once the cache expires
you get the "NO DATA" fallback instead of a crash.