3 min read
Copy-paste snippets
Copy-paste starting points. Each is a full page function and its real render. Mix and match; they're all drawing API and helper calls.
Header bar + title
A colored title bar with a headline below it.
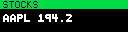
def main(c, ctx):
    c.clear()
    c.rect(0, 0, c.width - 1, 8, fill="green")
    c.text("STOCKS", 3, 1, font="5x7", color="black")
    c.text("AAPL 194.2", 3, 14, font="7x12", color="white")
Label / value rows
Left-aligned labels with right-aligned values, the classic dashboard layout.
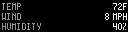
def main(c, ctx):
    c.clear()
    c.text("TEMP", 2, 3, font="4x7", color="gray")
    c.text_right("72F", 3, font="4x7", color="white")
    c.text("WIND", 2, 13, font="4x7", color="gray")
    c.text_right("8 MPH", 13, font="4x7", color="white")
    c.text("HUMIDITY", 2, 23, font="4x7", color="gray")
    c.text_right("40%", 23, font="4x7", color="white")
Big centered number
One big value with a small caption, useful for a single stat.

def main(c, ctx):
    c.clear()
    c.text_center("72", 1, font="16x20", color="green")
    c.text_center("DEGREES F", 24, font="4x5", color="gray")
Status dots + text
Colored dots paired with a status line.
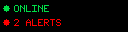
def main(c, ctx):
    c.clear()
    c.fill_circle(6, 8, 3, "green")
    c.text("ONLINE", 14, 5, font="5x7", color="green")
    c.fill_circle(6, 22, 3, "red")
    c.text("2 ALERTS", 14, 19, font="5x7", color="red")
Sparkline + last value
A trend line with the latest number and a direction arrow.

def main(c, ctx):
    c.clear()
    prices = [187, 189, 185, 191, 194, 190, 196, 199]
    c.sparkline(prices, 2, 3, 74, 26, color="cyan", fill=color.dim("cyan", 30))
    c.text("199", 84, 3, font="7x12", color="white")
    c.trend_arrow(90, 18, 1, color="green")
Two-column split (grid)
Use c.grid() to split the panel and place a value in each half.
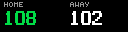
def main(c, ctx):
    c.clear()
    cells = c.grid(2, pad=3)
    c.text("HOME", cells[0]["x0"] + 4, 2, font="4x5", color="gray")
    c.text("108", cells[0]["x0"] + 4, 11, font="10x14", color="green")
    c.text("AWAY", cells[1]["x0"] + 4, 2, font="4x5", color="gray")
    c.text("102", cells[1]["x0"] + 4, 11, font="10x14", color="white")